Quickstart to TensorFlow
I decided to build the classic MNIST hello world digit recognition with a convolutional neural network in tensorflow. And then I wrote a small Tkinter user interface to draw numbers, sample them down and feed them into the estimator.
Installation
The installation is really straight forward if you have a virtualenv setup:
pip install tensorflow
You are also going to need numpy and matplotlib.
Test the installation
You can run this little script to check whether tensorflow was installed completely.
import tensorflow as tf
hello = tf.constant("Let's go, TensorFlow!")
sess = tf.Session()
print(sess.run(hello))
Detecting digits
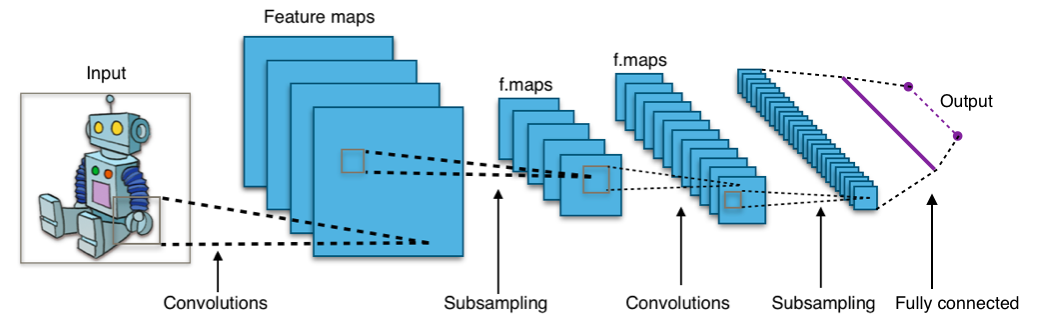
The introduction to tensorflow uses softmax regression which is a good starter for non-binary classification but I also found a good tutorial on how to use a convolutional neural network for this exercise.
 CC BY-SA 4.0 (user Aphex34 on wikipedia)
Every image in MNIST has 28x28 grayscale pixels (from 0.0 to 1.0) where 1.0 means black.
The setup of the CNN is:
- Convolution layer 1: from 28x28x1 to 28x28x32 because we apply 32 filter
- Pooling layer 1: from 28x28x32 to 14x14x32 with a pool size of 2x2
- Convolution layer 2: from 14x14x32 to 14x14x64
- Pooling layer 2: from 14x14x64 to 7x7x64 with pool size 2x2
- Dense layer: from 7x7x64 aligned to vectors to 1024x1
- Logits layer: 1024x1 to 10x1
Copy and paste the example code (Code tensorflow) into a file called cnn_mnist.py and run the python script.
The training took about one hour on Intel® Core™ i5-3320M CPU @ 2.60GHz × 4 (no gpu involved).
And the evaluation resulted in {'loss': 0.10442939, 'global_step': 20000, 'accuracy': 0.9688}.
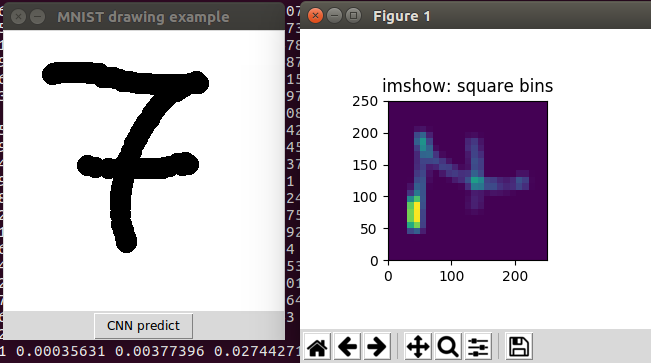
Drawing my own numbers
I patched the following user interface together:
import numpy as np
import tensorflow as tf
from cnn_mnist import cnn_model_fn
import matplotlib.pyplot as plt
import Tkinter as tk
import tkMessageBox


class Gui(object):
  def __init__(self):
    self.root = tk.Tk()
    self.root.title('MNIST drawing example')
    self.root.resizable(0,0)

    self.c = tk.Canvas(self.root, bg="white", width=280, height=280)

    self.c.configure(cursor="crosshair")
    self.c.pack()

    self.pen_width = 20
    self.c.bind("<B1-Motion>", self.paint )

    self.button_predict = tk.Button(self.root, text="CNN predict", command=self.predict_callback)
    self.button_predict.pack()

    self.points = set()

    self.mnist_classifier = tf.estimator.Estimator(model_fn=cnn_model_fn, model_dir="./mnist_convnet_model")

  def paint(self, event ):
    x1, y1 = ( event.x - self.pen_width ), ( event.y - self.pen_width )
    x2, y2 = ( event.x + self.pen_width ), ( event.y + self.pen_width )
    self.c.create_oval( x1, y1, x2, y2, fill = "black" )

    for x_ in range(x1,x2):
      for y_ in range(y1,y2):
        self.points.add((x_, y_))

  def get_histogram_data(self, show=True):

    xedges = list(range(0, 290, 10))
    yedges = list(range(0, 290, 10))

    points = [np.array([x,y], dtype=np.float32) for x,y in self.points]
    points = np.asarray(points)
    points = points.reshape(-1, 2)
    x = points[:,0]
    y = points[:,1]
    H, xedges, yedges = np.histogram2d(x, y, bins=(xedges, yedges))
    H /= 100.0


    if show:
      fig = plt.figure(figsize=(7, 3))
      ax = fig.add_subplot(131, title='imshow: square bins')
      plt.imshow(H, interpolation='nearest', origin='low',
              extent=[xedges[0], xedges[-1], yedges[0], yedges[-1]])
      plt.show()

    H = H.astype(np.float32)

    return H

  def predict_callback(self):
    data = self.get_histogram_data(show=True)

    eval_input_fn = tf.estimator.inputs.numpy_input_fn(
      x={"x": data },
      num_epochs=1,
      shuffle=False)

    eval_results = self.mnist_classifier.predict(input_fn=eval_input_fn)

    result = list(eval_results)[0]['classes']

    tkMessageBox.showinfo("Mnist CNN reports", "Your drawing is a {}".format(result))


if __name__ == '__main__':
  g = Gui()
  g.root.mainloop()
Where the few interesting lines are:
self.mnist_classifier = tf.estimator.Estimator(model_fn=cnn_model_fn, model_dir="./mnist_convnet_model")
This loades the trained model from the directory “mnist_convnet_model” (it might be in “/temp/mnist_convnet_model” on your machine)
def get_histogram_data(self, show=True): samples the 280x280 pixels on the canvas down to 28x28 buckets containing values from 0.0 to 1.0.
    eval_input_fn = tf.estimator.inputs.numpy_input_fn(
      x={"x": data },
      num_epochs=1,
      shuffle=False)

    eval_results = self.mnist_classifier.predict(input_fn=eval_input_fn)
And this part wraps the 1d-numpy array called data into a function that is callable to deliver the format for the .predict(...) method of the estimator.
Final result
This was fun. Although I have to say that it really doesn’t work perfectly. The digits are easy mistaken and I have the feeling that my data is far too clean. I guess I would have to downsample it properly to improve the results.