Decision Tree
I have got a small data set (my working hours as a working student) on which I want to train a binary classifier to tell working days from non-working days apart. My regular days in the office changed depending on the lectures I attended.
Cleaning the data set
The data set contains one row for every work day. The row contains every necessary information in German: “Donnerstag, 8. Juni (9:00 - 18:00) -> 8h (1h Mittag): Shop system”
So I wrote a function which extracts every weekday, day and year for a given time frame get_dates_table(start_date, end_date) and two functions that can generate the training data and the test data. The test data generates two years and the training data one year. The design matrix of each of them looks like this (where label is a boolean stating whether I went to work on that day):
| weekday | day | month | label |
|---|---|---|---|
| 5 | 1 | 3 | 0 |
| 6 | 2 | 3 | 1 |
| 7 | 3 | 3 | 1 |
| 1 | 4 | 3 | 1 |
Objective: I don’t expect the classifier to tell workday from normal weekday apart because the pattern changes over time but what I want is that we can differentiate between weekday and day of the weekend which should not be too hard.
Let’s take a look at the data set
Histogram of the days I went to work
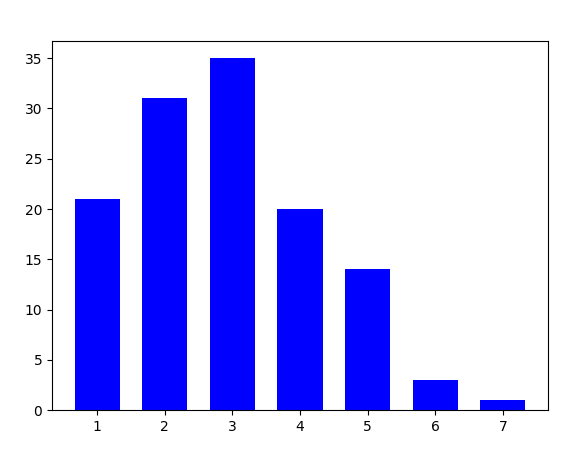
This plot shows the amount of days I went to work by week day in the test data (one year). The enumeration starts with 1=Monday and ends with 7=Sunday.
Decision tree

By Acoggins38 (Own work) [CC BY-SA 4.0 (https://creativecommons.org/licenses/by-sa/4.0)], via Wikimedia Commons
A decision tree is the output of algorithms that find the most discriminating features and value borders in the data. The tree can then be used like a search tree with the difference that the leaf maps to which class the data belongs to. (A good tutorial to write a CART like algorithm: https://www.youtube.com/…)
Training
We use the DecisionTreeClassifier from sklearn and output a graph as a visualization.
from sklearn import tree

features, labels = get_training_data()
clf = tree.DecisionTreeClassifier()
clf = clf.fit(features, labels)

tree.export_graphviz(clf, feature_names=['weekday', 'day', 'month'])
The generated tree.dot file can be viewed in graphiz or http://webgraphviz.com/.
The generated tree is so huge that I cannot view it as a image on one monitor:
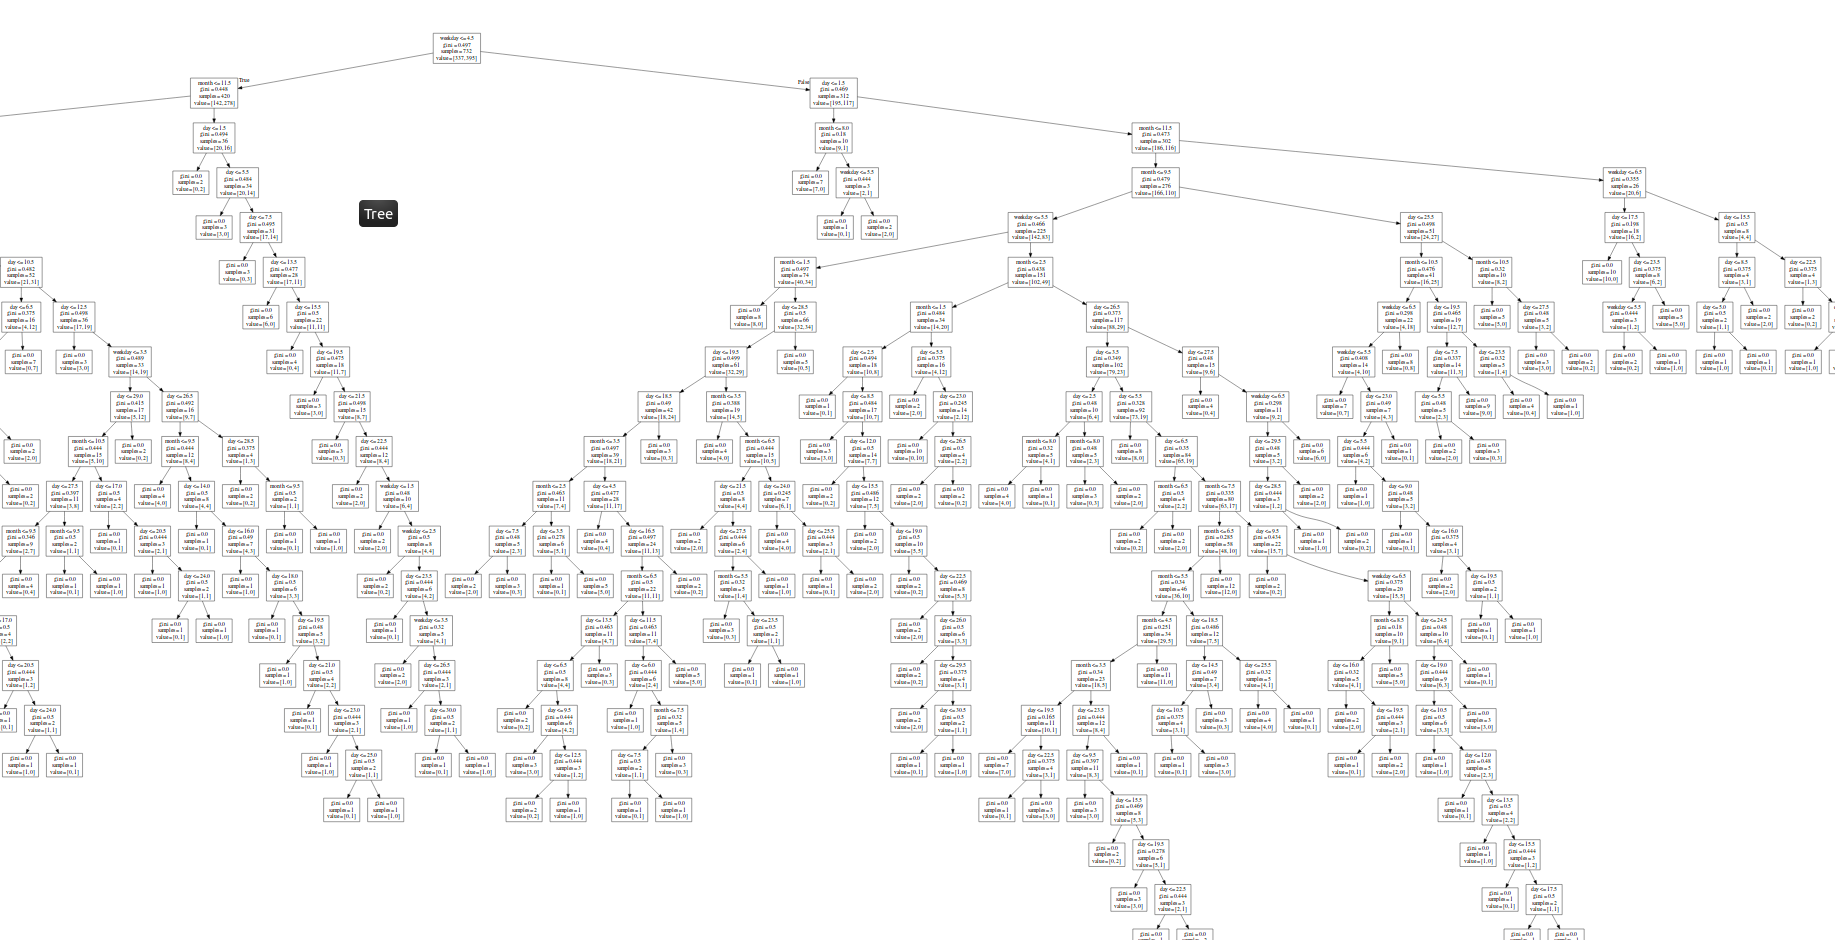
The tree makes me sceptic although the first node looks promising because it says that the most important feature is the weekday and whether it is less than friday or not.
Testing
test_features, test_labels = get_test_data()
predictions = clf.predict(test_features)

ok = 0
max_ = len(test_labels)
for supervision, predition, test_feature in zip(test_labels, predictions, test_features):
    ok += 1 if supervision == predition else 0

print("OK={} WRONG={} => ERROR={}%".format(ok, max_ - ok, int((max_ - ok) * 100 / max_)))
This code snippet prints OK=110 WRONG=52 => ERROR=32% to the console.
32% errors seems to be a lot. Let’s figure out whether this is only drawing from random.
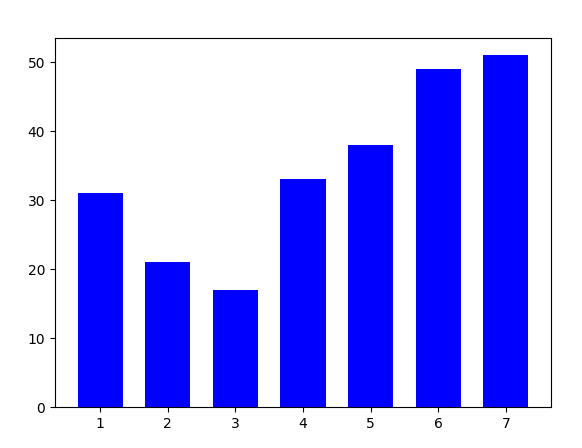
The following plot shows the inverse of the weekday plot, so it says on which days I did not go to work.
Let’s sum up the work days vs the non-work days:
| workdays | non workdays | total |
|---|---|---|
| 125 | 240 | 365 |
| 34% | 66% | 100% |
Result: If our estimator made the assumption that every day is a “non workday” then it would be equally good as the DecisionTree.
Training again
This time I am only going to use the weekday feature.
from sklearn import tree

features, labels = get_training_data()
# only use the first column
feature_weekday = np.asarray(features)[:, 0]

clf = tree.DecisionTreeClassifier()
clf = clf.fit(features, labels)

tree.export_graphviz(clf, feature_names=['weekday', 'day', 'month'])
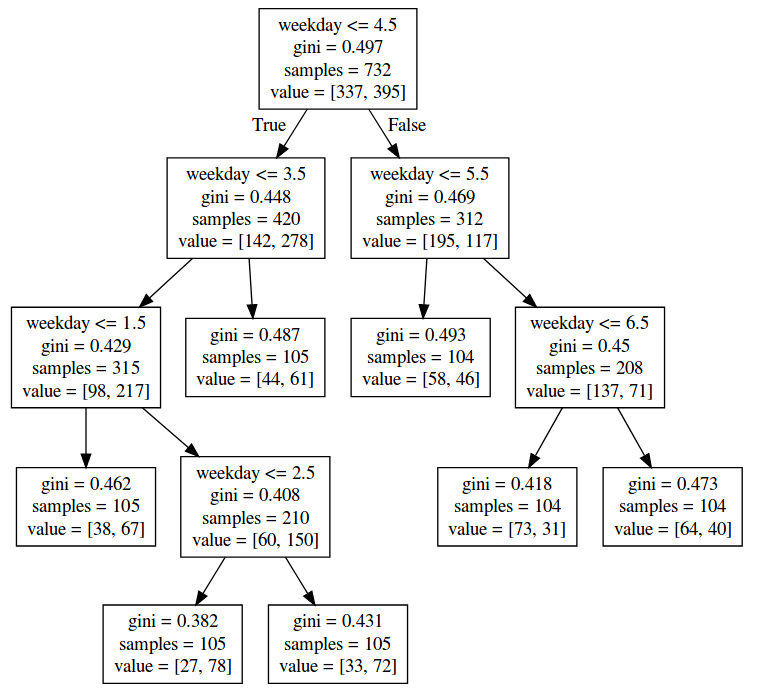
The tree shrinks with only one feature but the first node stays more or less the same.
Testing again
This way the error can be reduced to 29% (OK=115 WRONG=47 => ERROR=29%)
If I only feed the weekends to the DecisionTree the error is reduced to 4% because it predicts every day as a non-workday (error comes from two saturdays).
If I only feed the weekdays to the DecisionTree the result is OK=71 WRONG=45 => ERROR=38%. The probability to draw a workday from the days monday to friday by random is 46%. I conclude therefore that the decision tree helps a little bit in this scenario although it’s less than 10%.
But one can say that the weekends are identified good enough.
(Having spent some time with the data now I think modelling the data with a gamma distribution or using k-nearest-neighbours would result in better results.)