VoG: Summarizing and understanding large graphs
In summer 2017 I attended a data mining seminar. Every participant had to summarize and analyze a different algorithm.
Mine was ”VoG - Summarizing and Understanding Large Graphs” by Danai Koutra (Carnegie Mellon University), U Kang (KAIST), Jilles Vreeken (Max Planck Institute for Informatics and Saarland University) and Christos Faloutsos (Carnegie Mellon University).
The algorithm finds instances of a given graph vocabulary in a large graph. For example: stars, clique, bi-partite cores, etc…
My “paper” about the algorithm can be found here: analysis-article-vog.pdf.
Own experiment
In order to challenge their solution I got their matlab code (after fixing some api changes introduced by matlab) to run.
They shipped their code with a really simple example graph which I visualized using gephi (Fruchterman and Reingold layout).
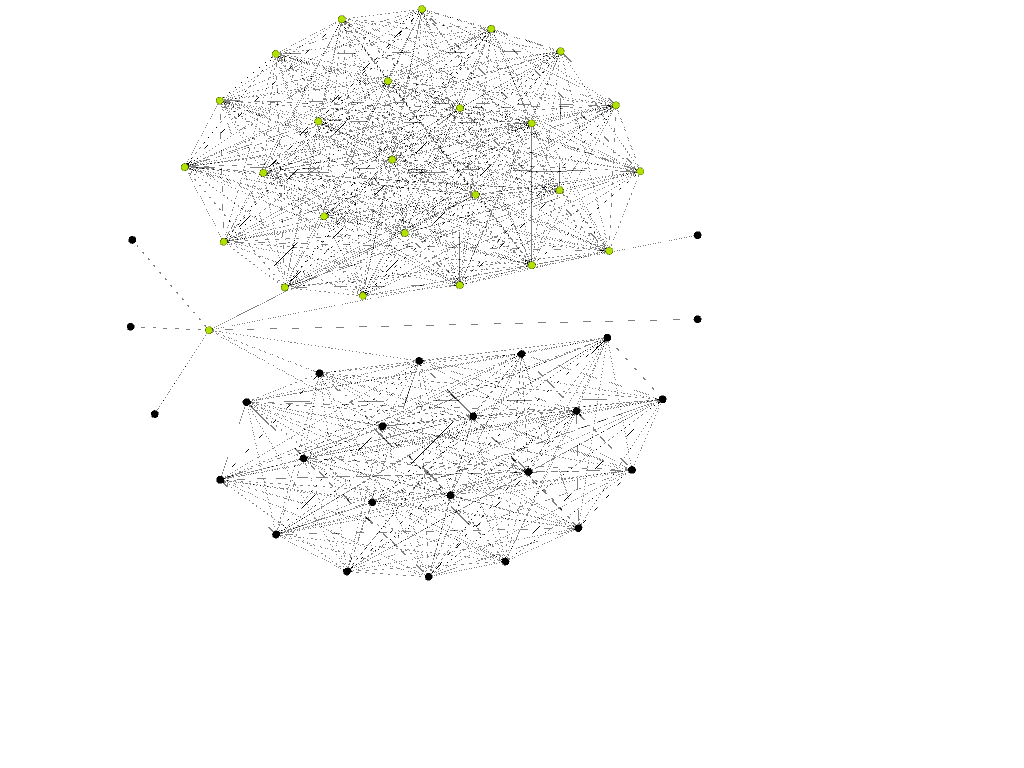
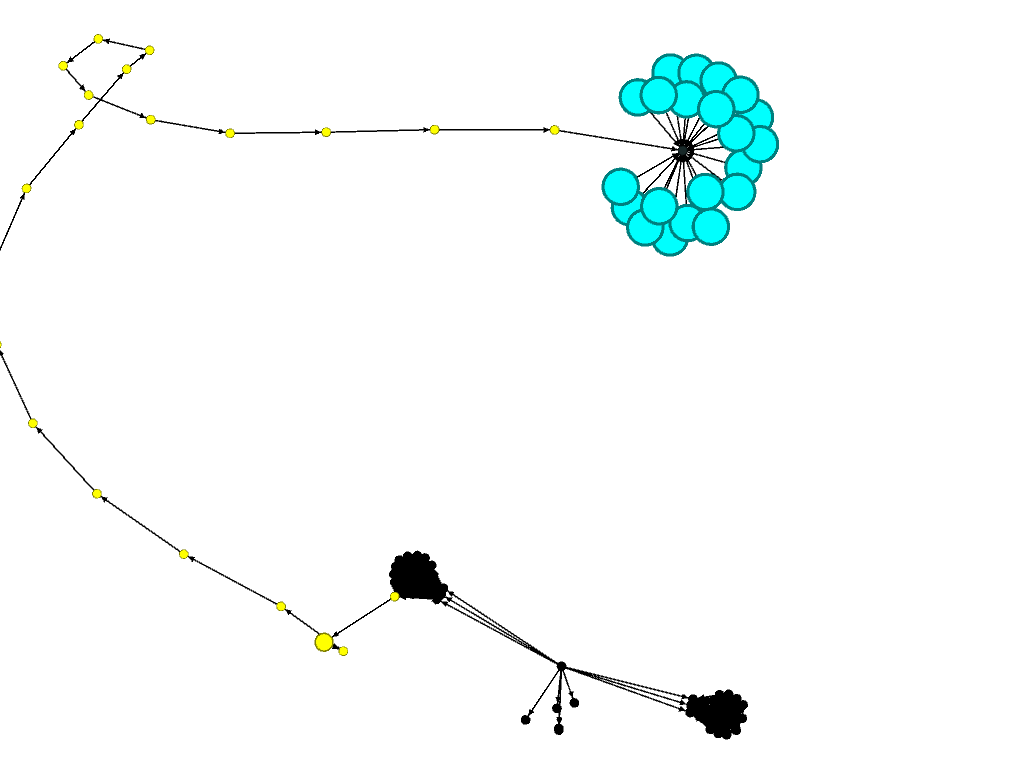
The VoG worked as expected on that graph. So it was time to make some changes to the graph and see if it will work as expected. The following image shows the two cliques (black), the chain (yellow) and the star (cyan) of which my altered graph consisted (layouting is force atlas 2). To a human the three main “components” are quite obvious.
Running the VoG returns the following output:
1    nb 53 55 57 59 61 63 65 67 69 71, 52 54 56 58 60 ...
2    fc 30 31 32 33 34 35 36 37 38 39 40 41 42 43 44 45 46 47 48 49 50
3    fc 1 2 3 4 5 6 7 8 9 10 11 12 13 14 15 16 17 18
10    fc 21 27 28 29 30 31 32 33 34 35 36 37 38 39 40 41 42 43 44 45 46 47 48 49 50 51
21    fc 1 2 3 4 5 6 7 8 9 10 11 12 13 14 15 16 17 18 19 20 21
Which means it “sees” a near bi-partite core in the first place and full cliques after that. No chain, no star! Therefore I came to the conclusion that either I did a mistake using their code (not too likely because I did not change too much), my graph is too “artificial” or the algorithm does not perform very well.